2015
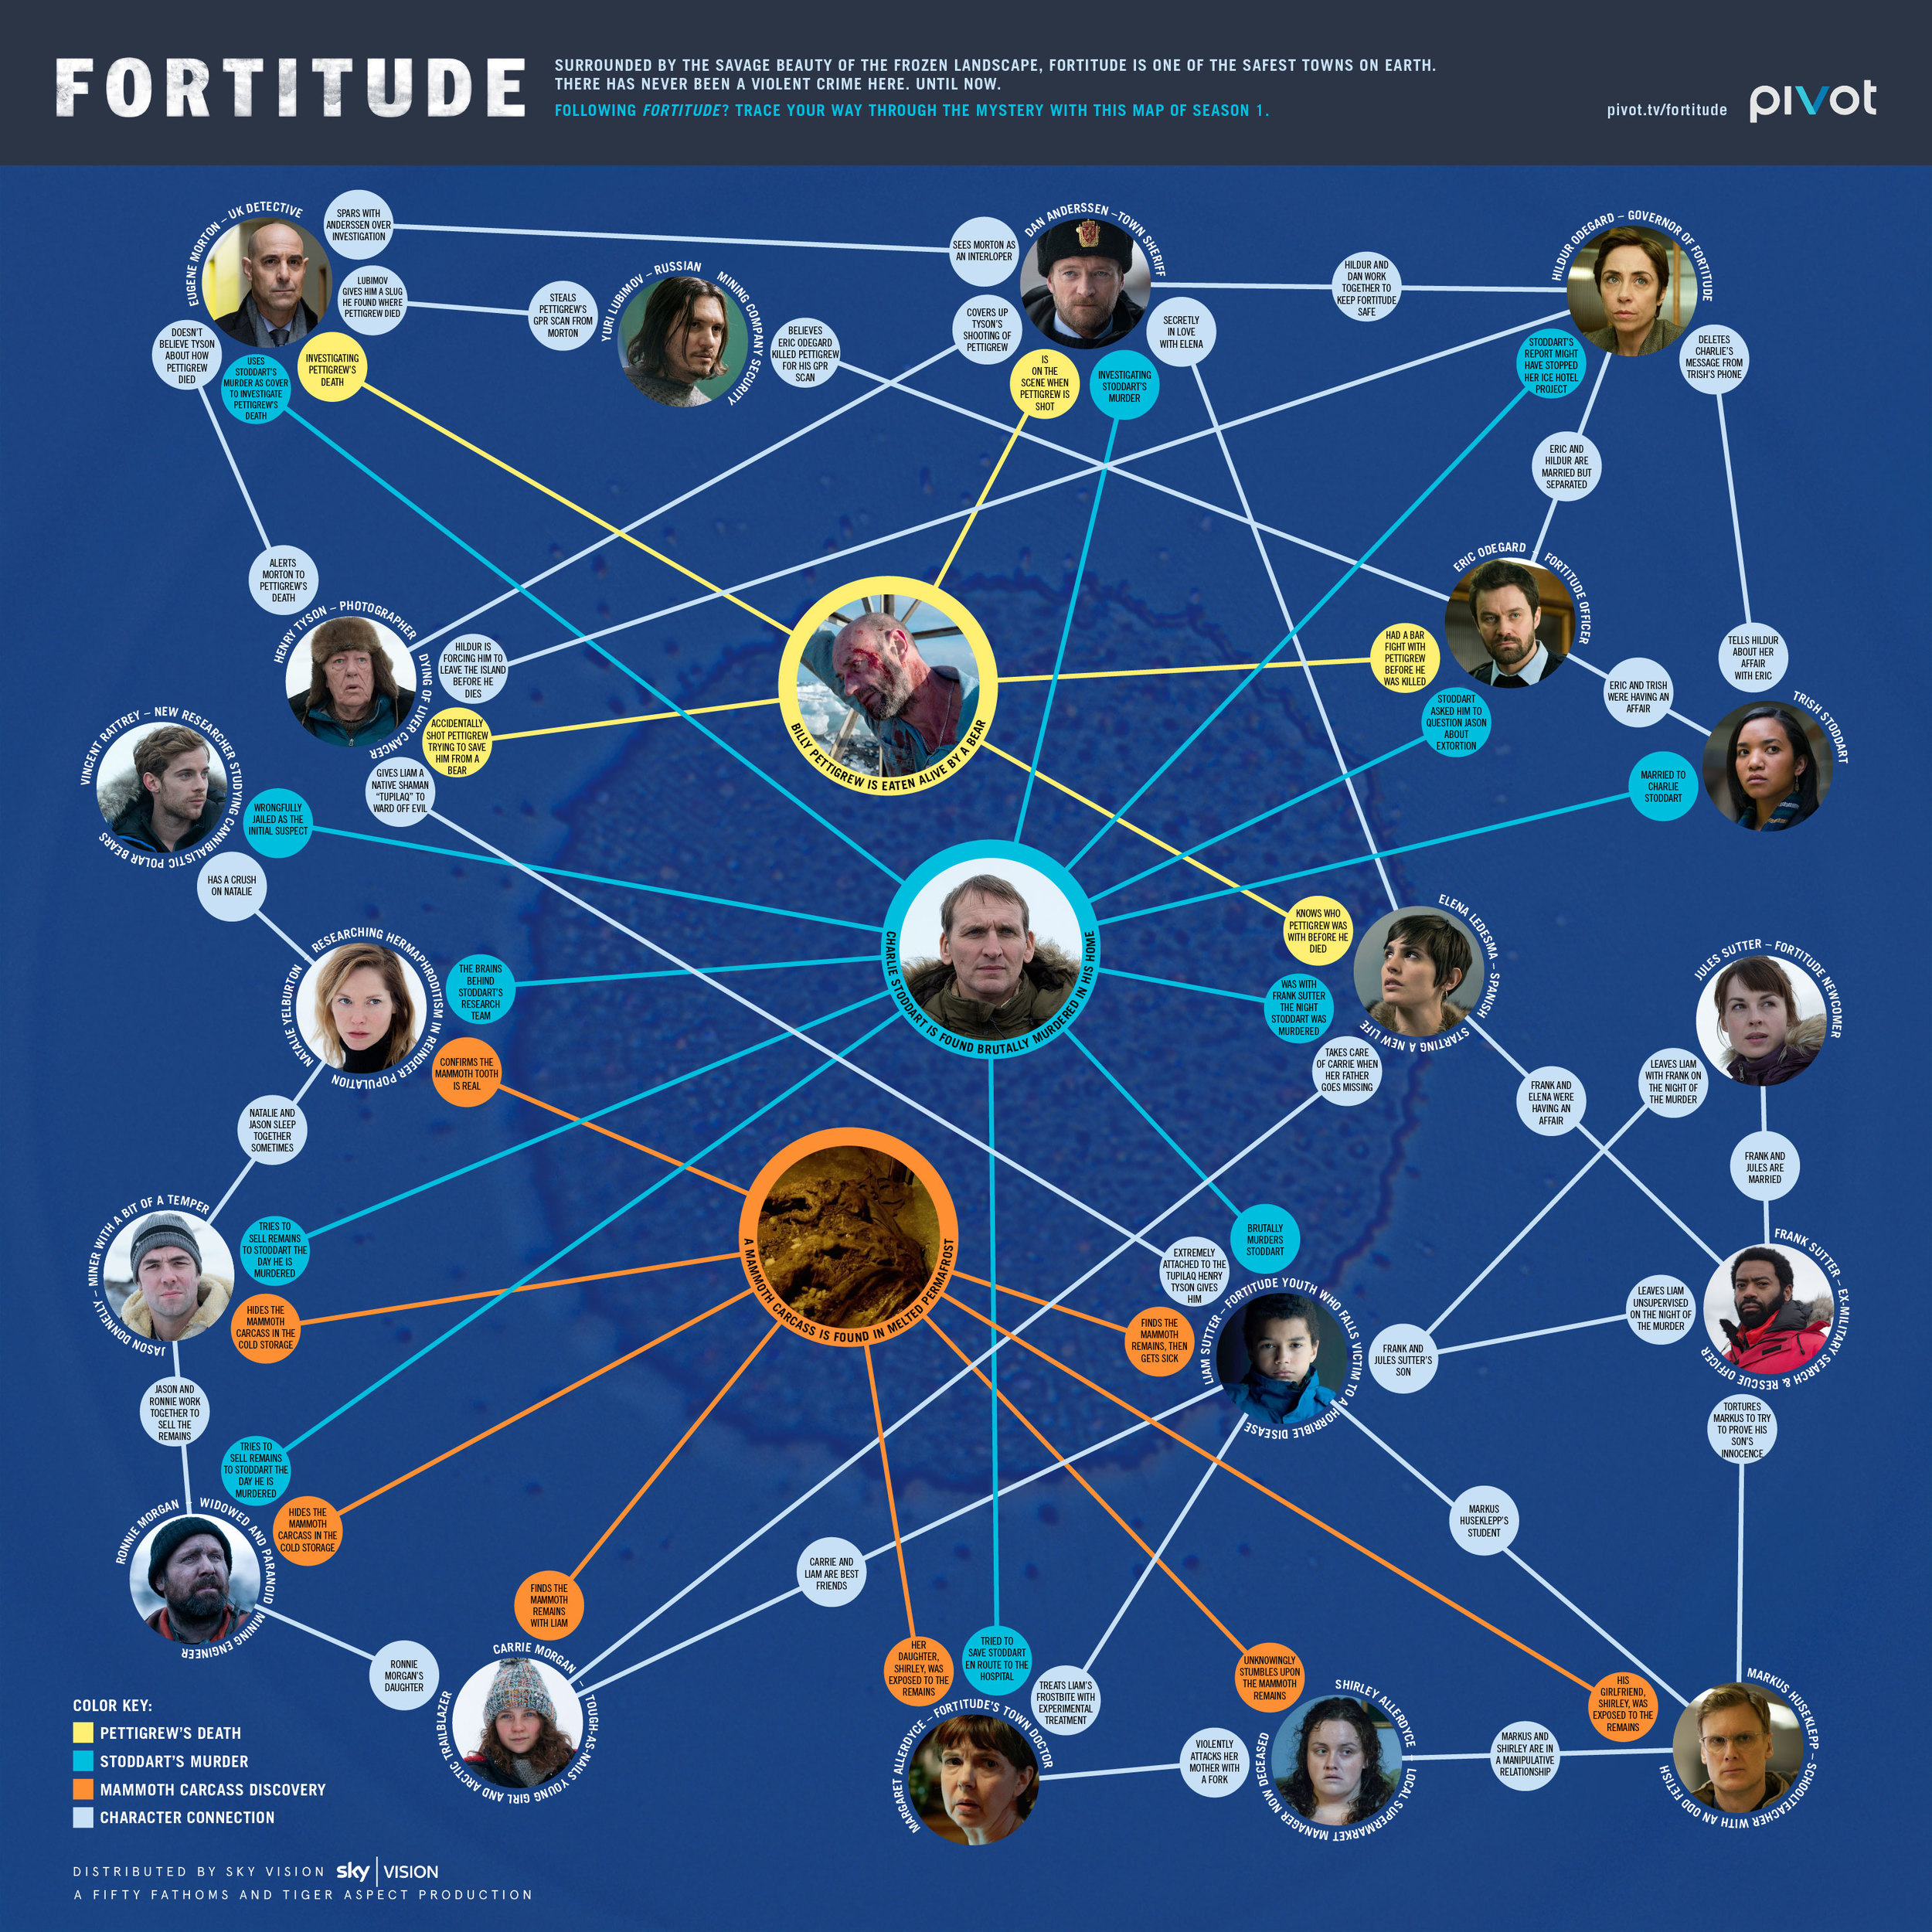
An infographic to accompany the last episode of the TV series "Fortitude", about a small town in the Antarctic which begins to experience some strange occurrences. Creating a detailed map of the connections between each character and the reasons for their actions provided a fun promotional tool for the show website.

2015
A comprehensive chart showing side-views of all significant Batmobiles used by Batman, created for Comic Book Resources. This was particularly tricky since some of the cars have never been shown from a side-view (or in the case of the "Batman v Superman: Dawn of Justice" there were not yet side-view images available), and so it became necessary to collect and study every angle available in order to extrapolate the construction of the side of the cars.
(Click here to view at full size.)

2015
A detailed comparison of the classic Batman television show car with Nolan's "Tumbler" from his Batman trilogy, created for Comic Book Resources. Each of the various functions and features of each car are detailed. To view more types of batmobile, check out the comprehensive chart here.
(Click here to view at full size.)
2012
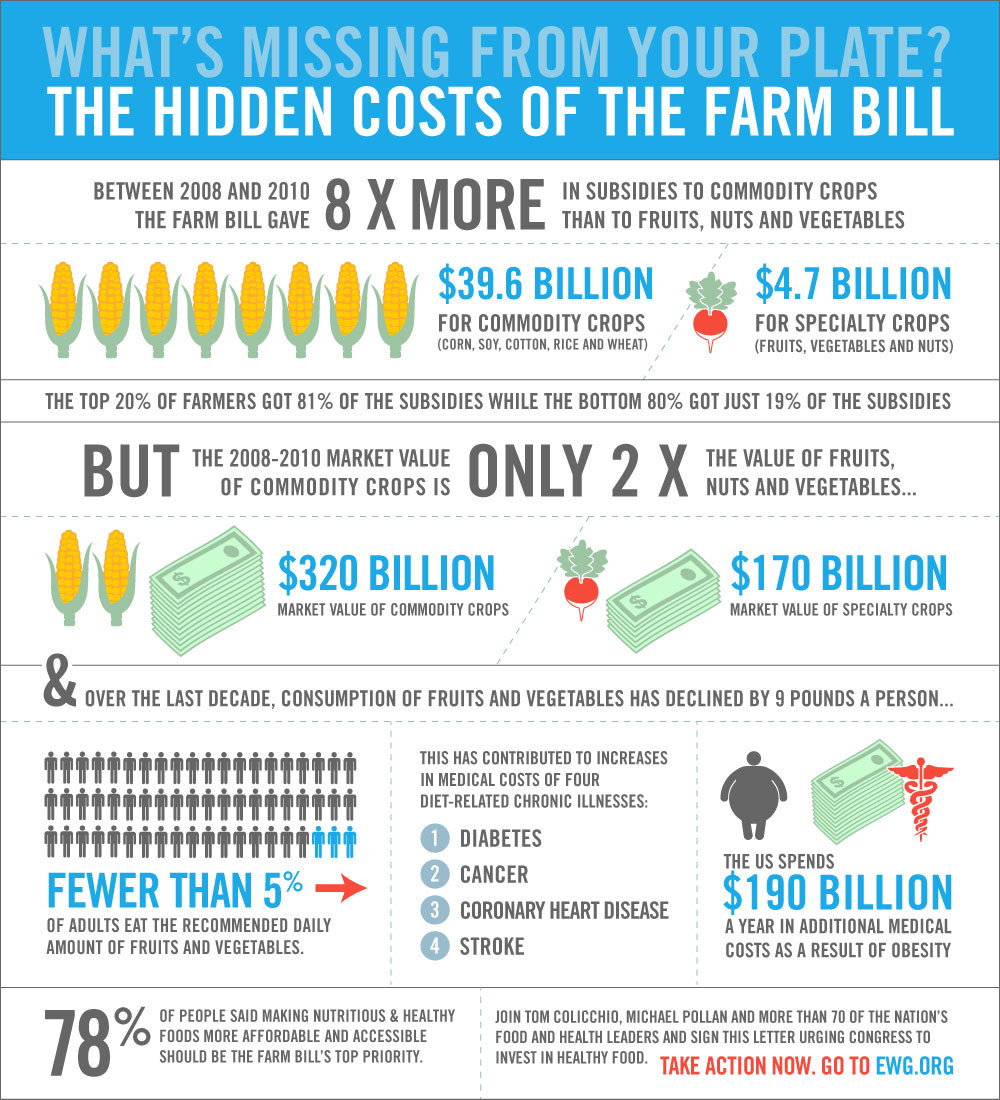
I created this infographic for Participant Media and TakePart about the hidden diet and medical costs of Farm Bill food subsidies. More information on the
2014
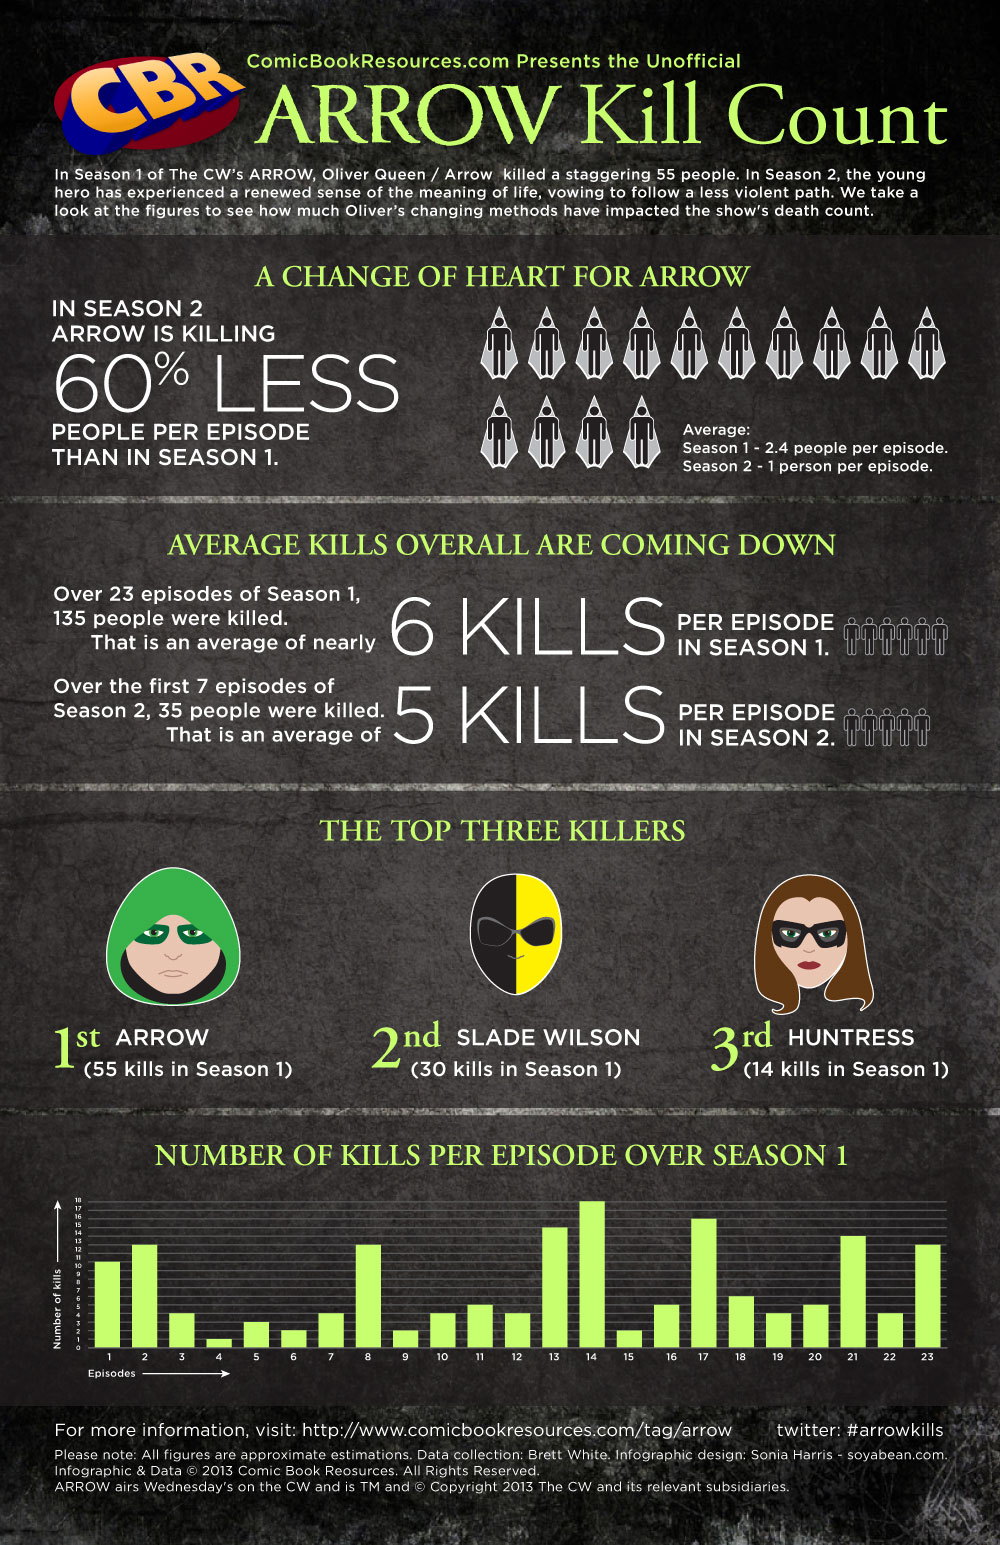
An infographic to explore the changing kill count of the CW television show, Arrow. Combining icons, illustration, and bar charts to examine the statistics.
(Click here to view at full size.)
2013
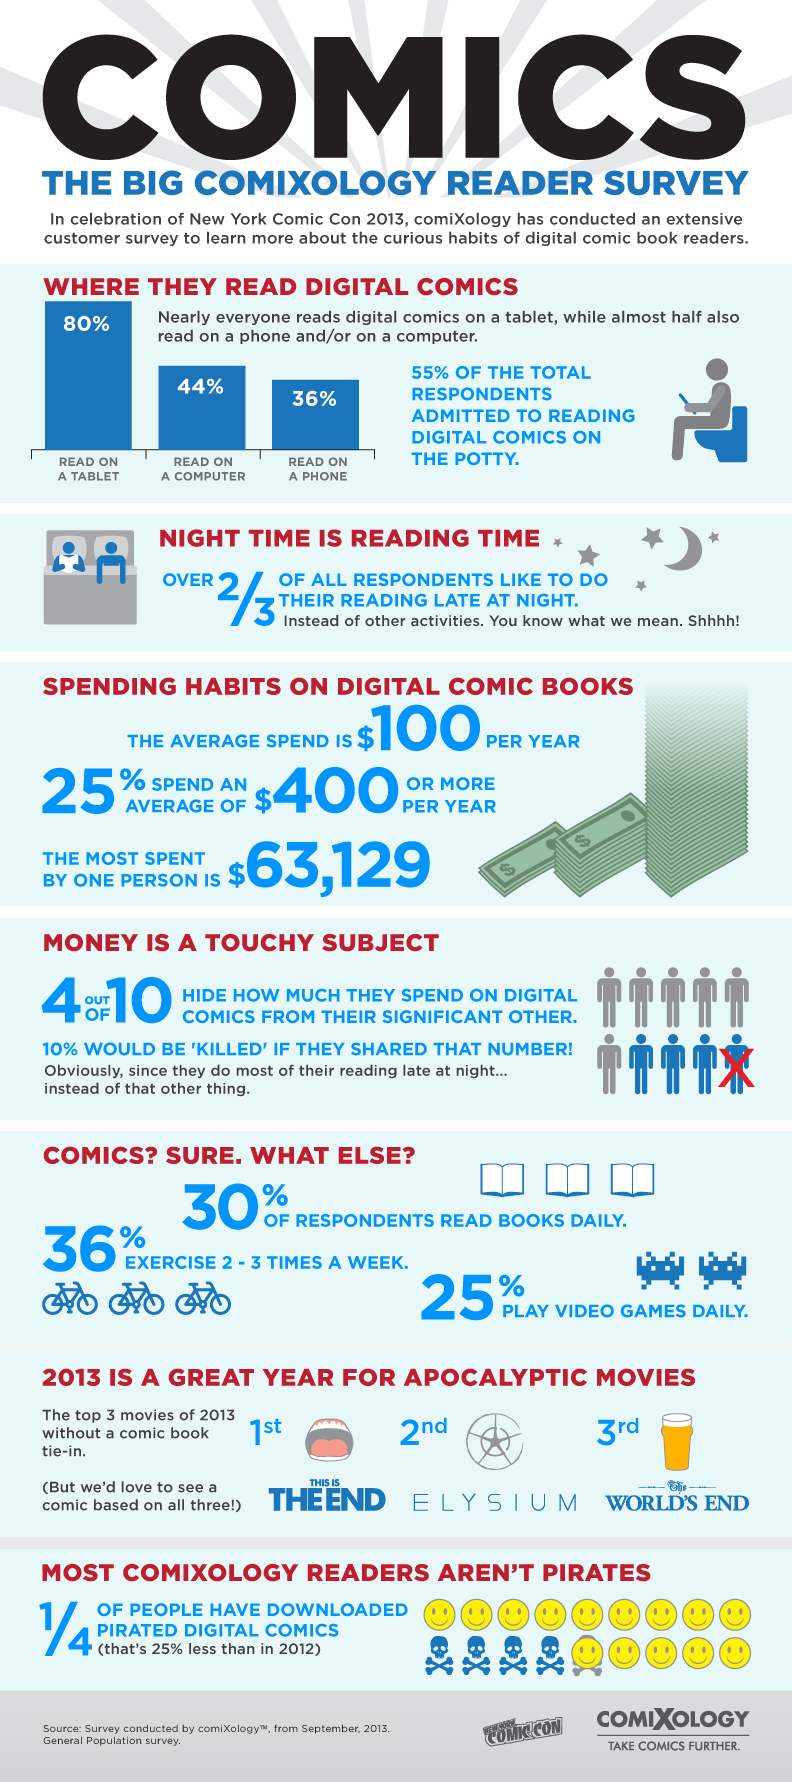
Graphics and iconography to illustrate and explain the results of a survey of comic book readers' leisure habits, conducted by ComiXology.
(Click here to view at full size.)

2014
The center four pages of a six page, wordless illustration to describe the moment when the world ends and is reborn at the conclusion of the 12 issue comic book from Image Publishing, by Joe Casey and David Messina.
A digital collage of my photography with illustrative elements created in Photoshop and Illustrator.
2013
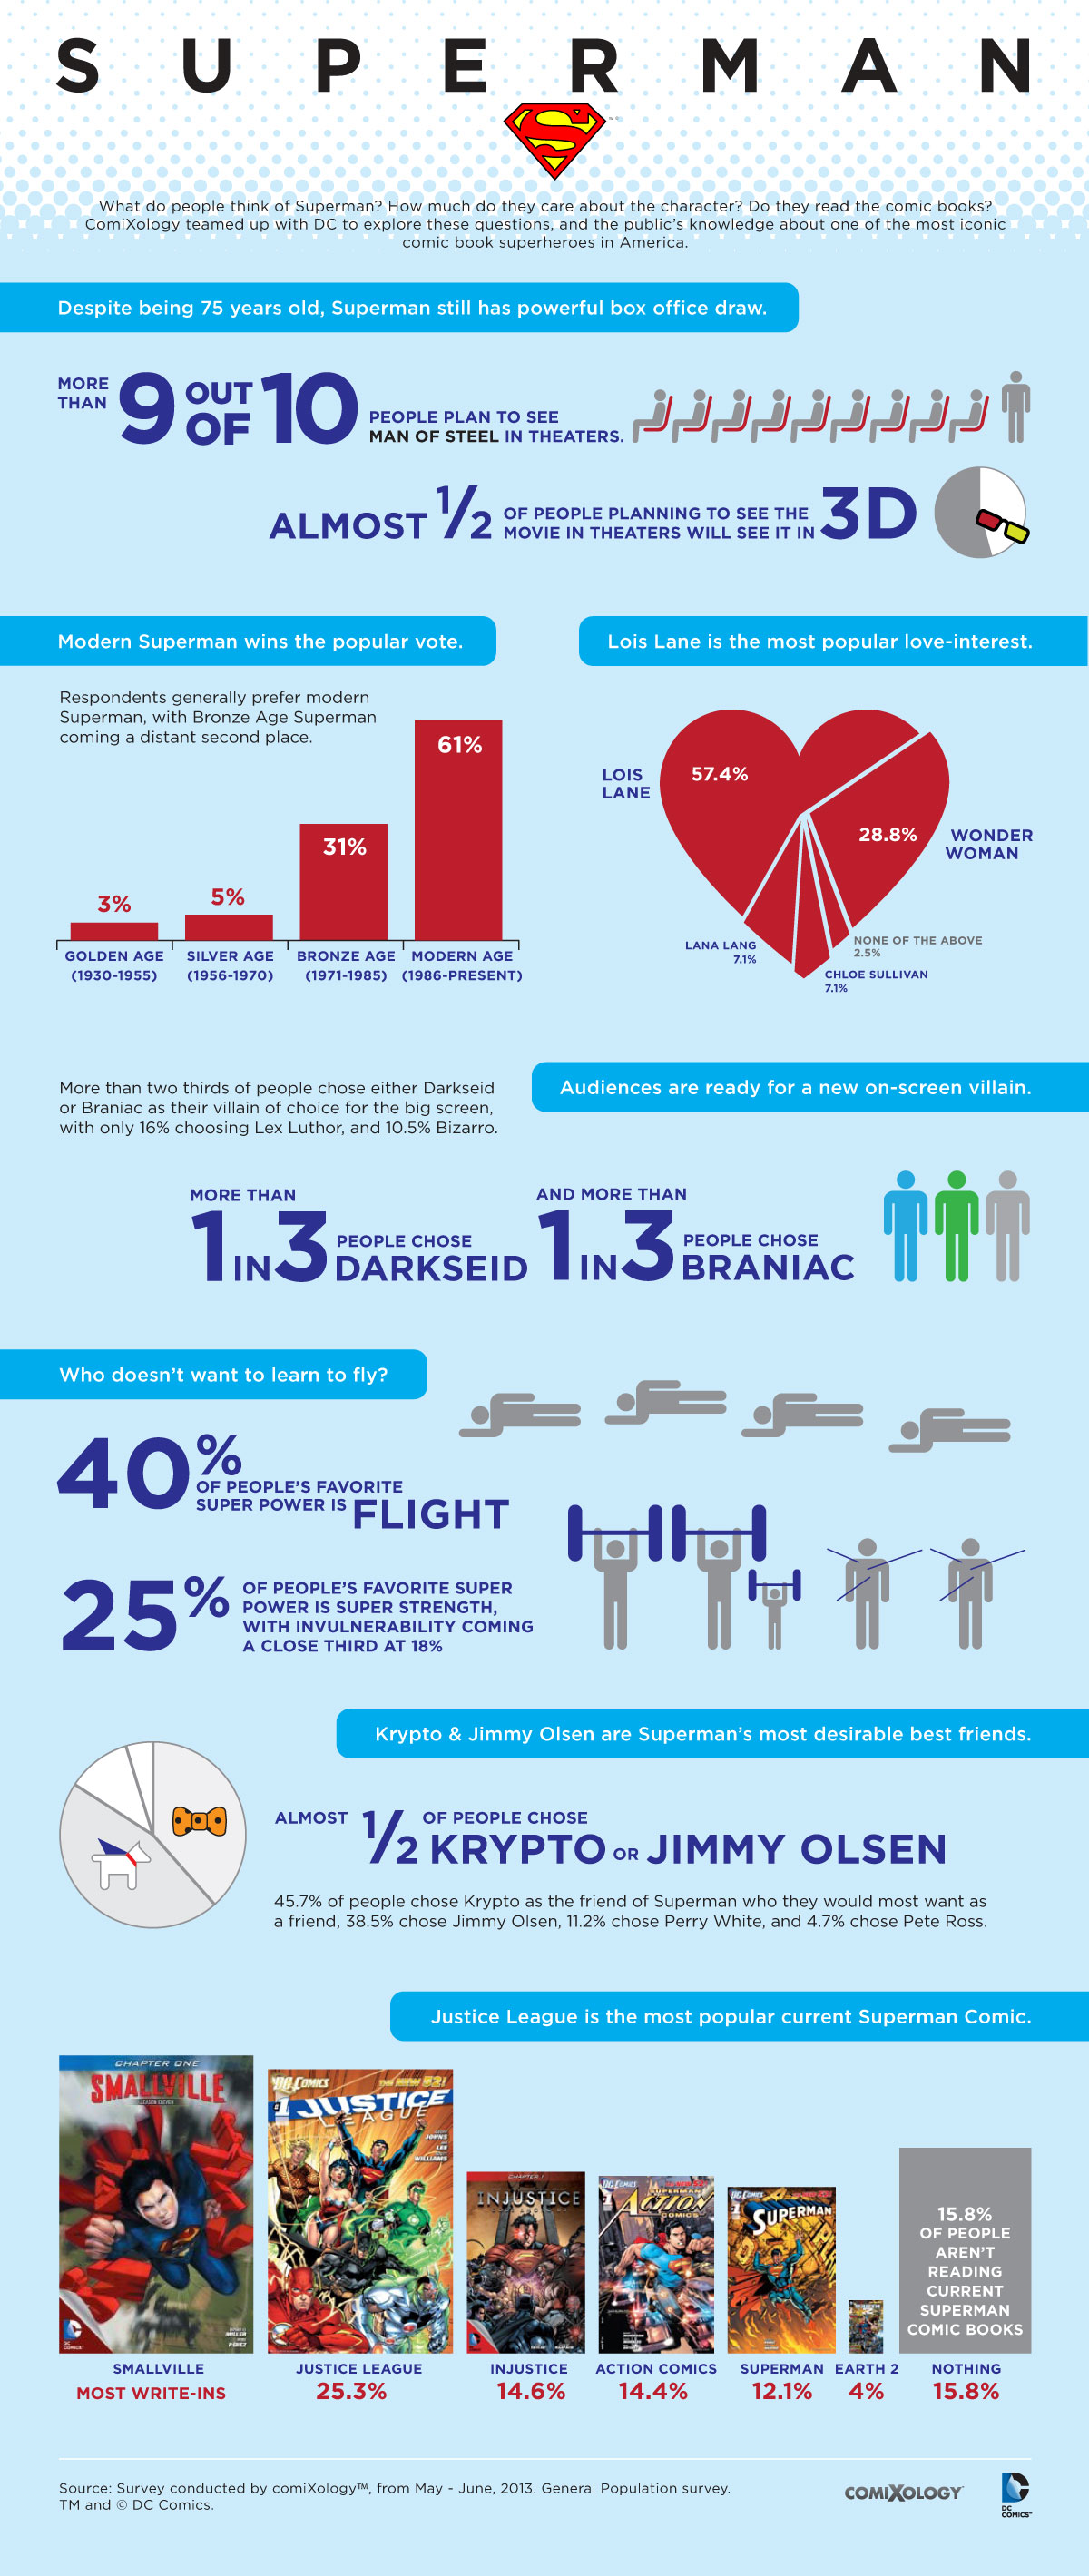
Graphics explaining and expanding on the results of an extensive survey of Superman comic book readers, conducted by ComiXology with DC Comics (released in conjunction with the movie "Man of Steel".)
(Click here to view at full size.)
2013
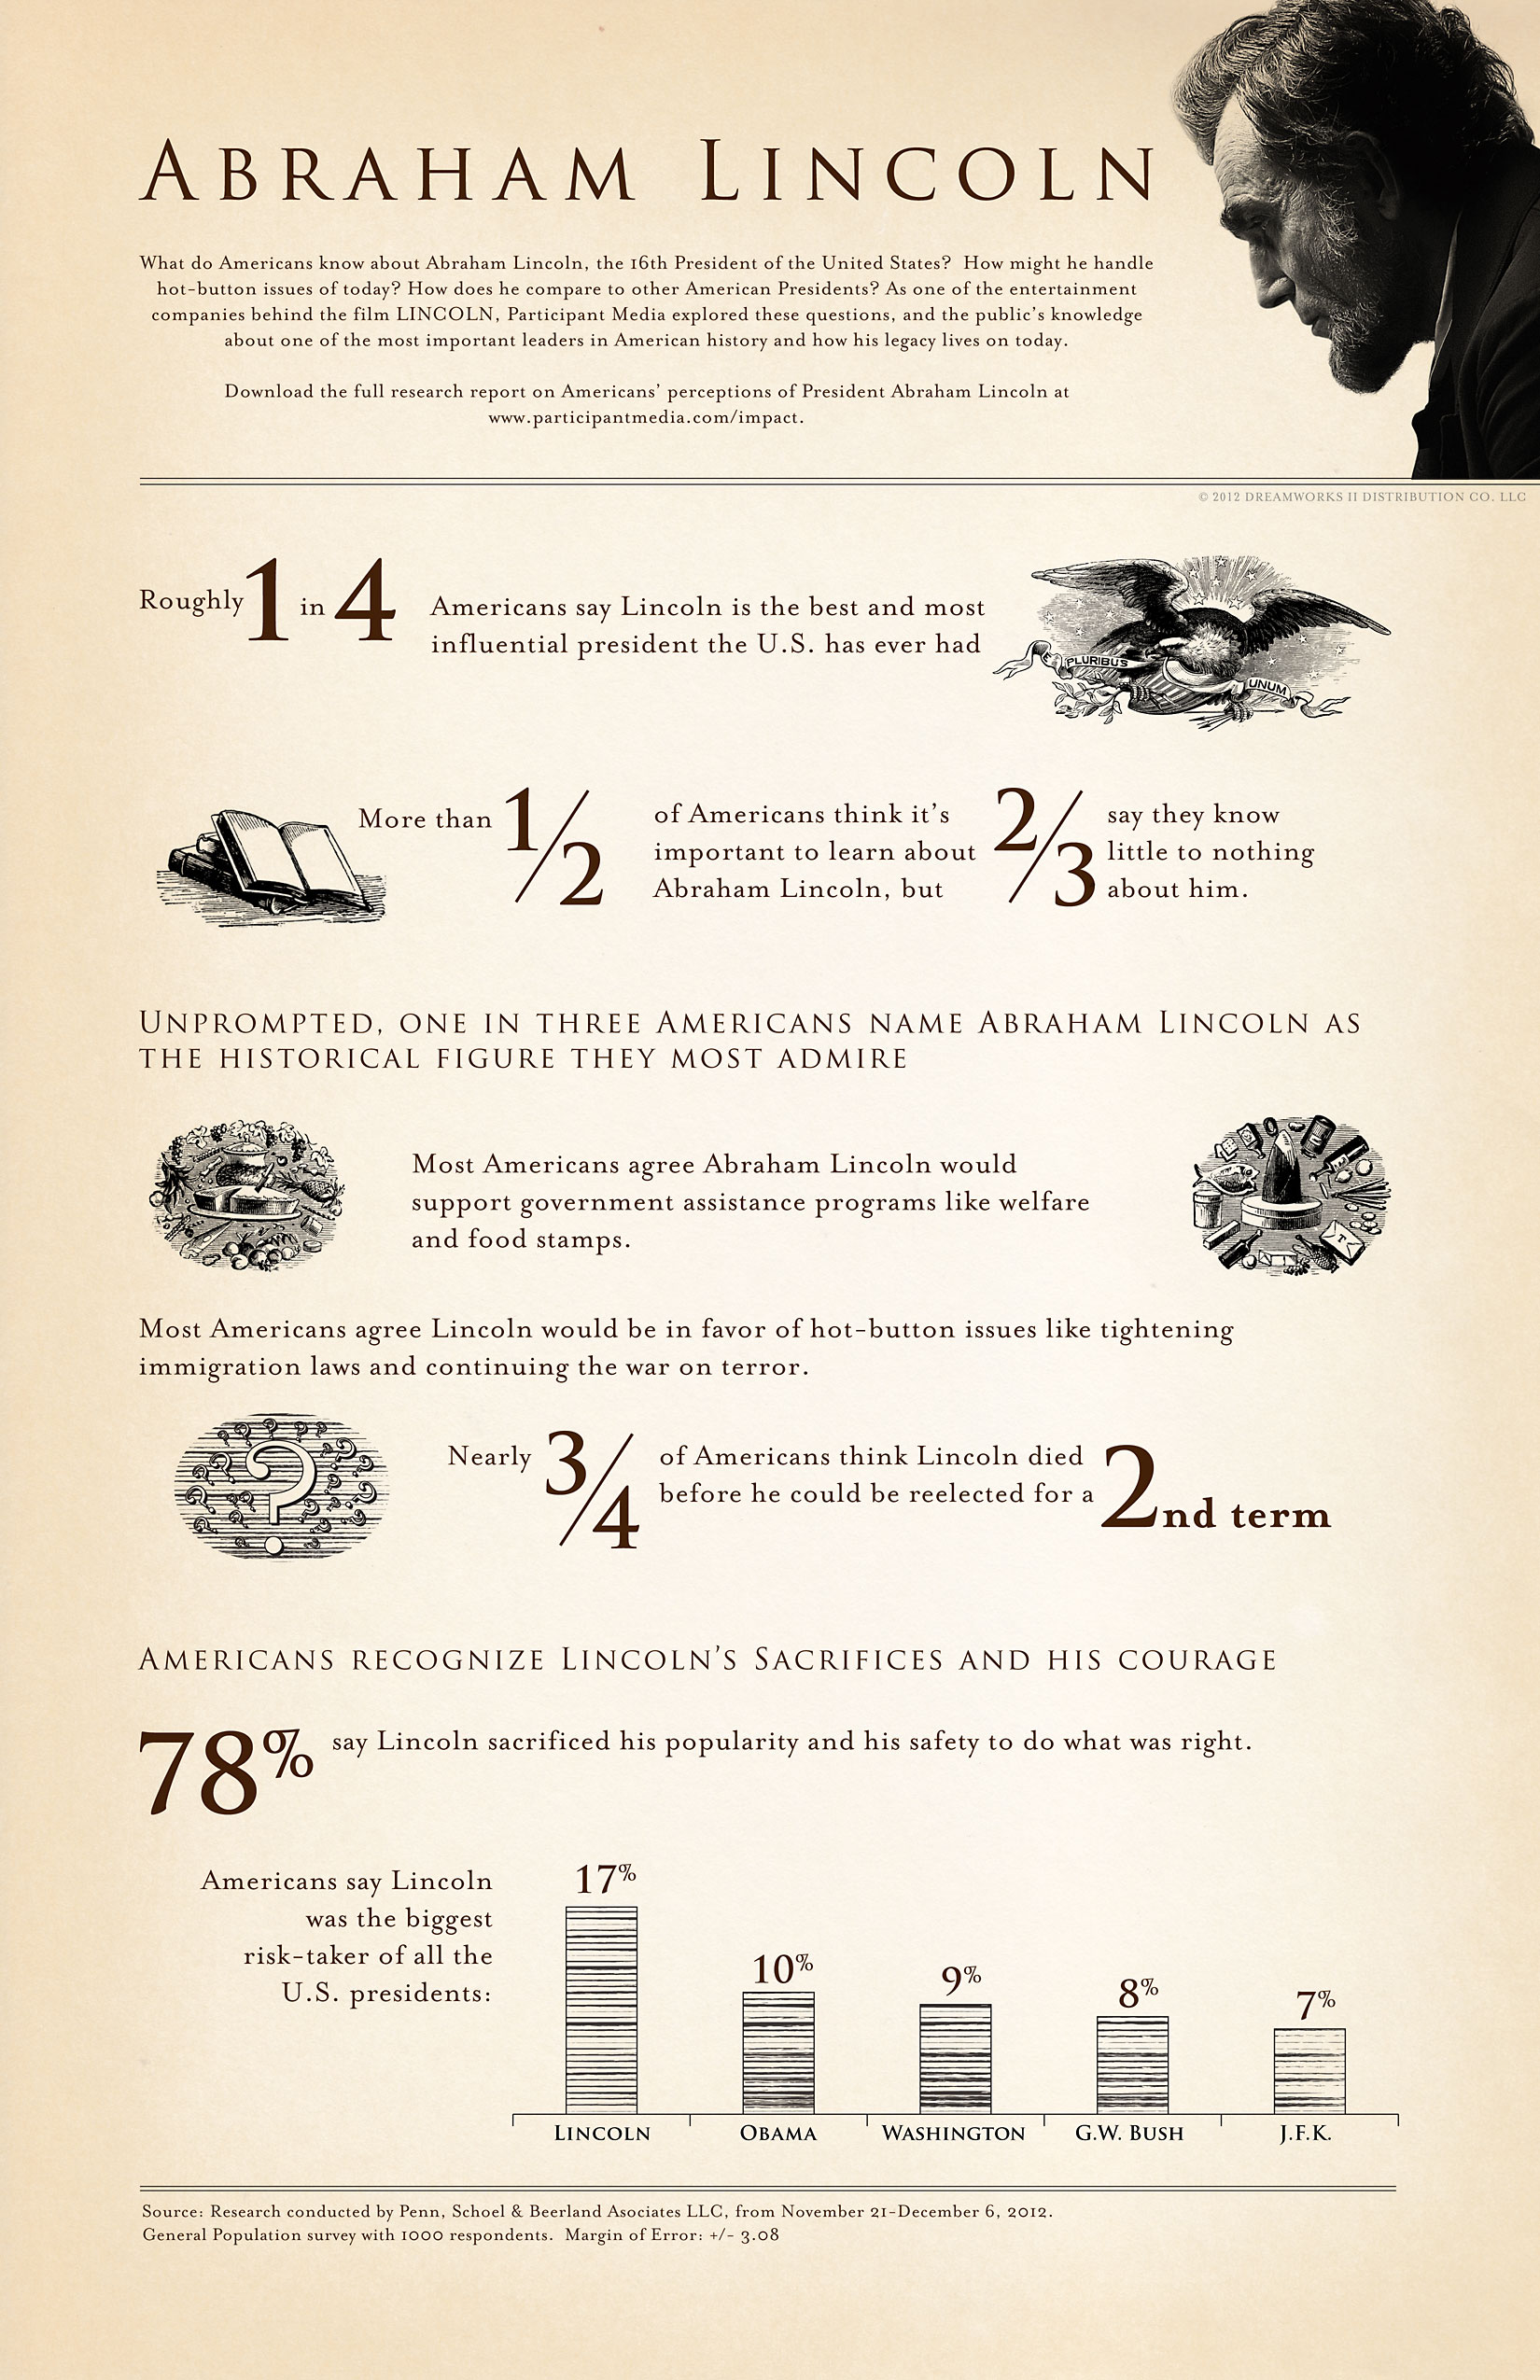
Sepia-toned infographic using period graphics to illustrate the findings of a contemporary study of American's awareness of President Lincoln for Take Part and Participant Media (released in conjunction with the movie.)
(Click here to view at full size.)
2012
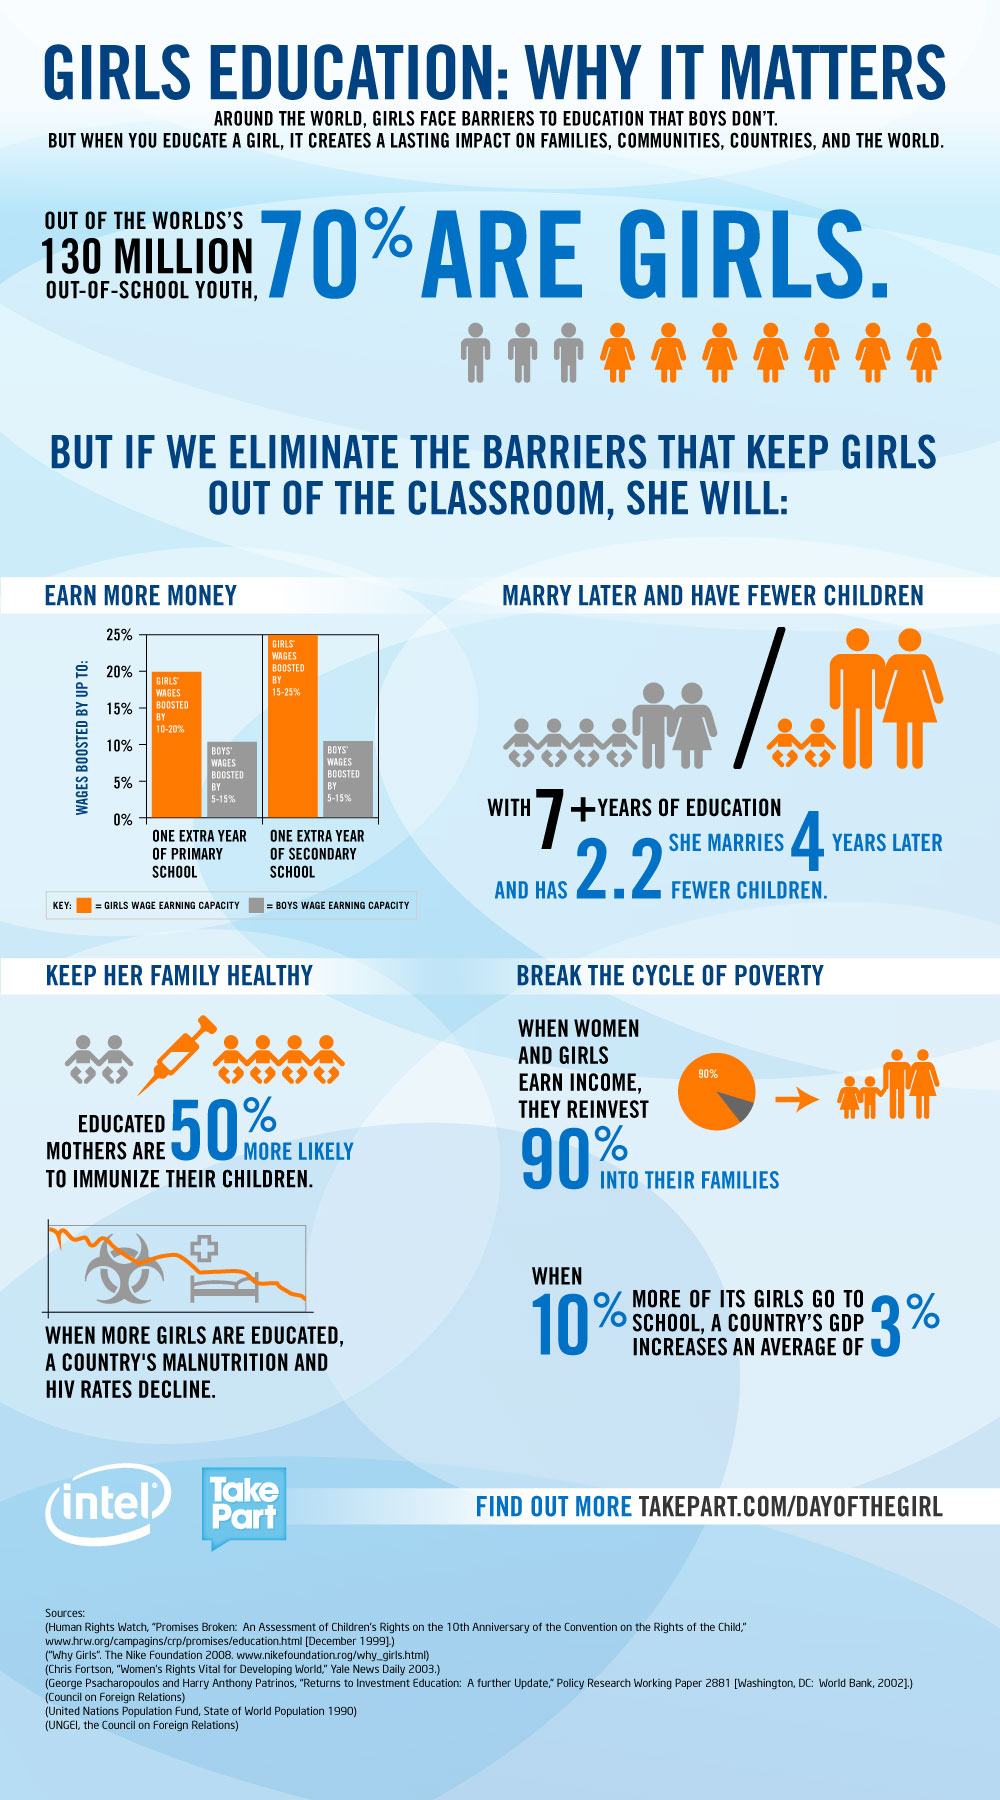
An infographic celebrating the United Nations first ever “International Day of the Girl” on October 10th, this highlights how educating girls benefits all of society. Using the Intel color scheme and font for the body copy, with the TakePart title font for headers creates brand reinforcement for both companies.
(Click here to view at full size.)
2012
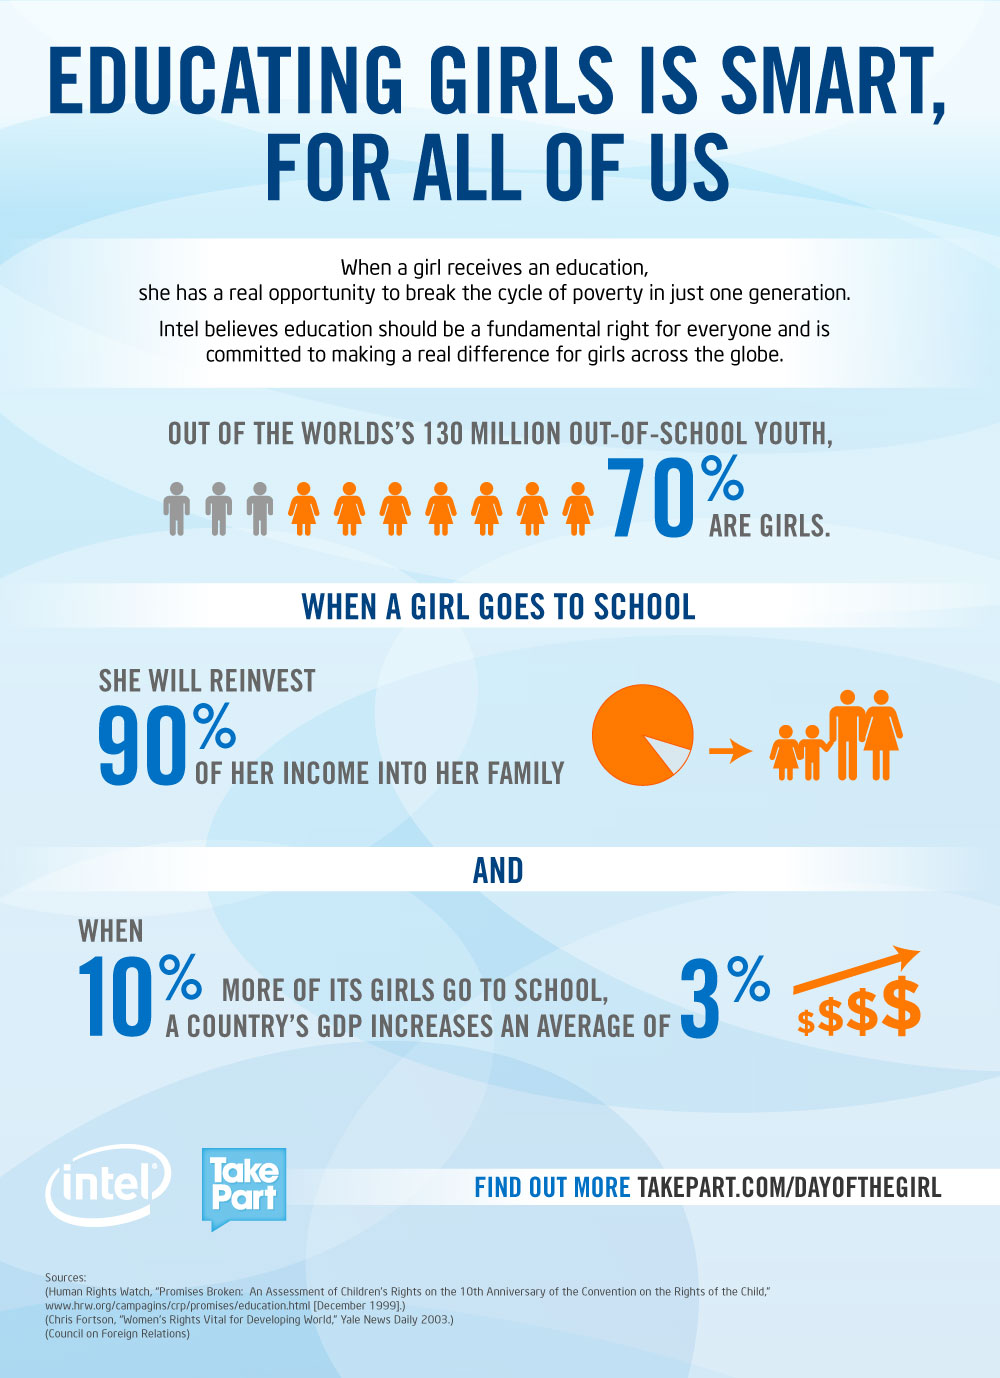
A simplified infographic celebrating the United Nations first ever “International Day of the Girl” on October 10th, this highlights how educating girls benefits all of society. Using the Intel color scheme and font for the body copy, with the TakePart title font for headers creates brand reinforcement for both companies.
(Click here to view at full size.)
2012
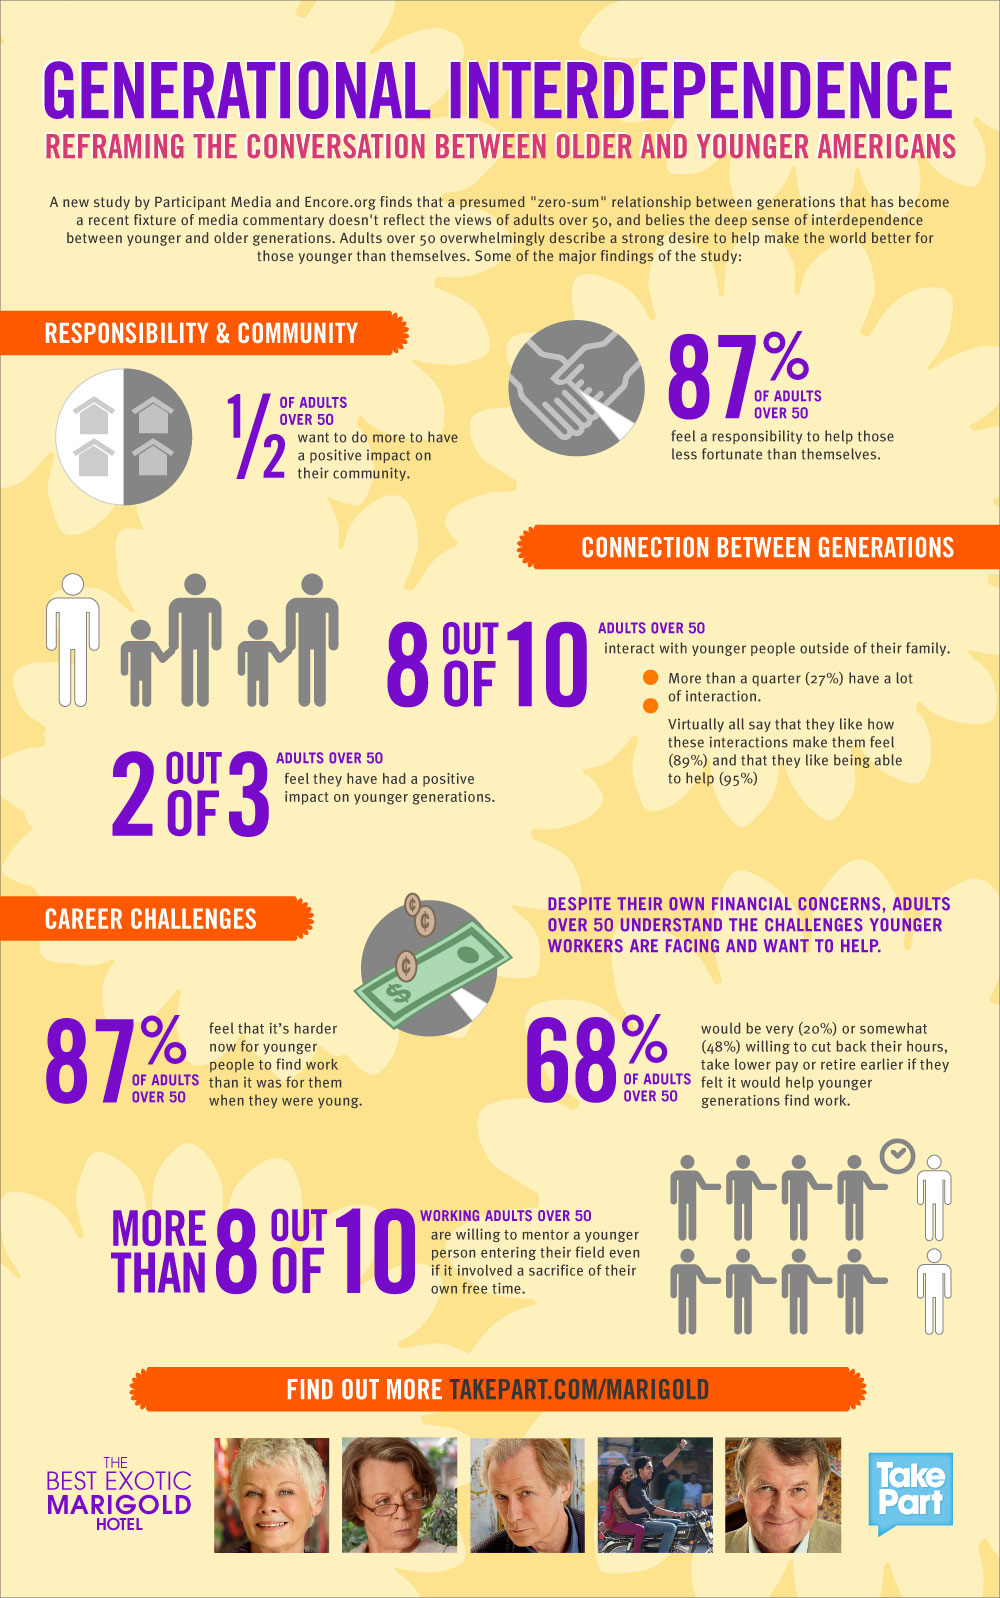
Infographic to illustrate research associated with themes raised in the film “The Best Exotic Marigold Hotel”, this supplements the research section on the Take Part website for the film. This version uses a vector outline of the marigolds used in film branding. More information on the website.
(Click here to view at full size.)

2011
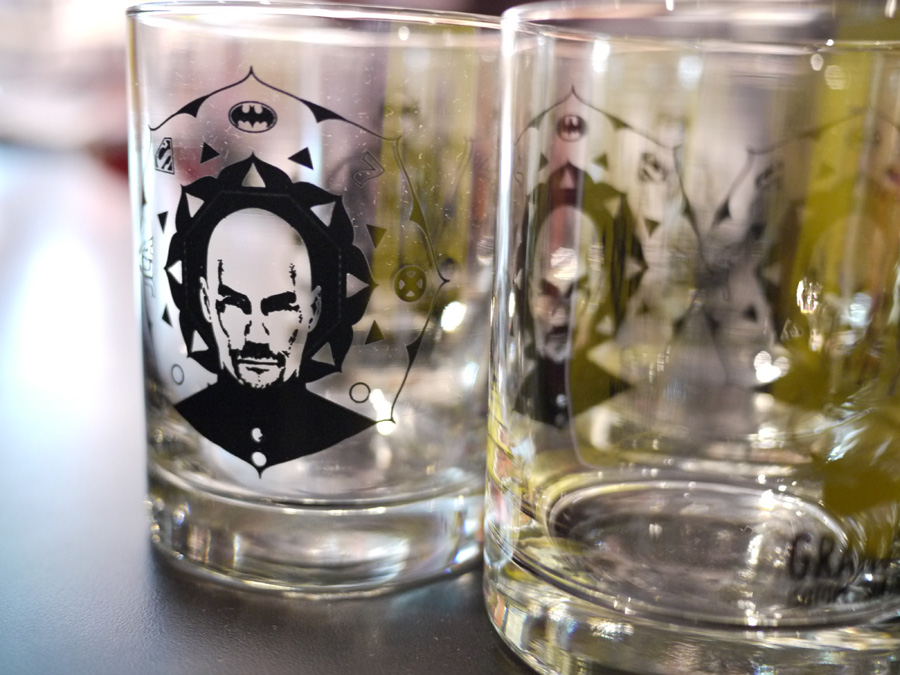
Illustrative Grant Morrison logo to commemorate signing party for his book “Supergods” at San Francisco's Isotope Comics. Designed. Designed to emulate a Buddhist mandala, using symbolic shapes to represent Morrison’s creative process.
2011
Illustrative Grant Morrison logo to commemorate signing party for his book “Supergods” at San Francisco's Isotope Comics. Designed. Designed to emulate a Buddhist mandala, using symbolic shapes to represent Morrison’s creative process.

2008
2006

2005

2005
2004
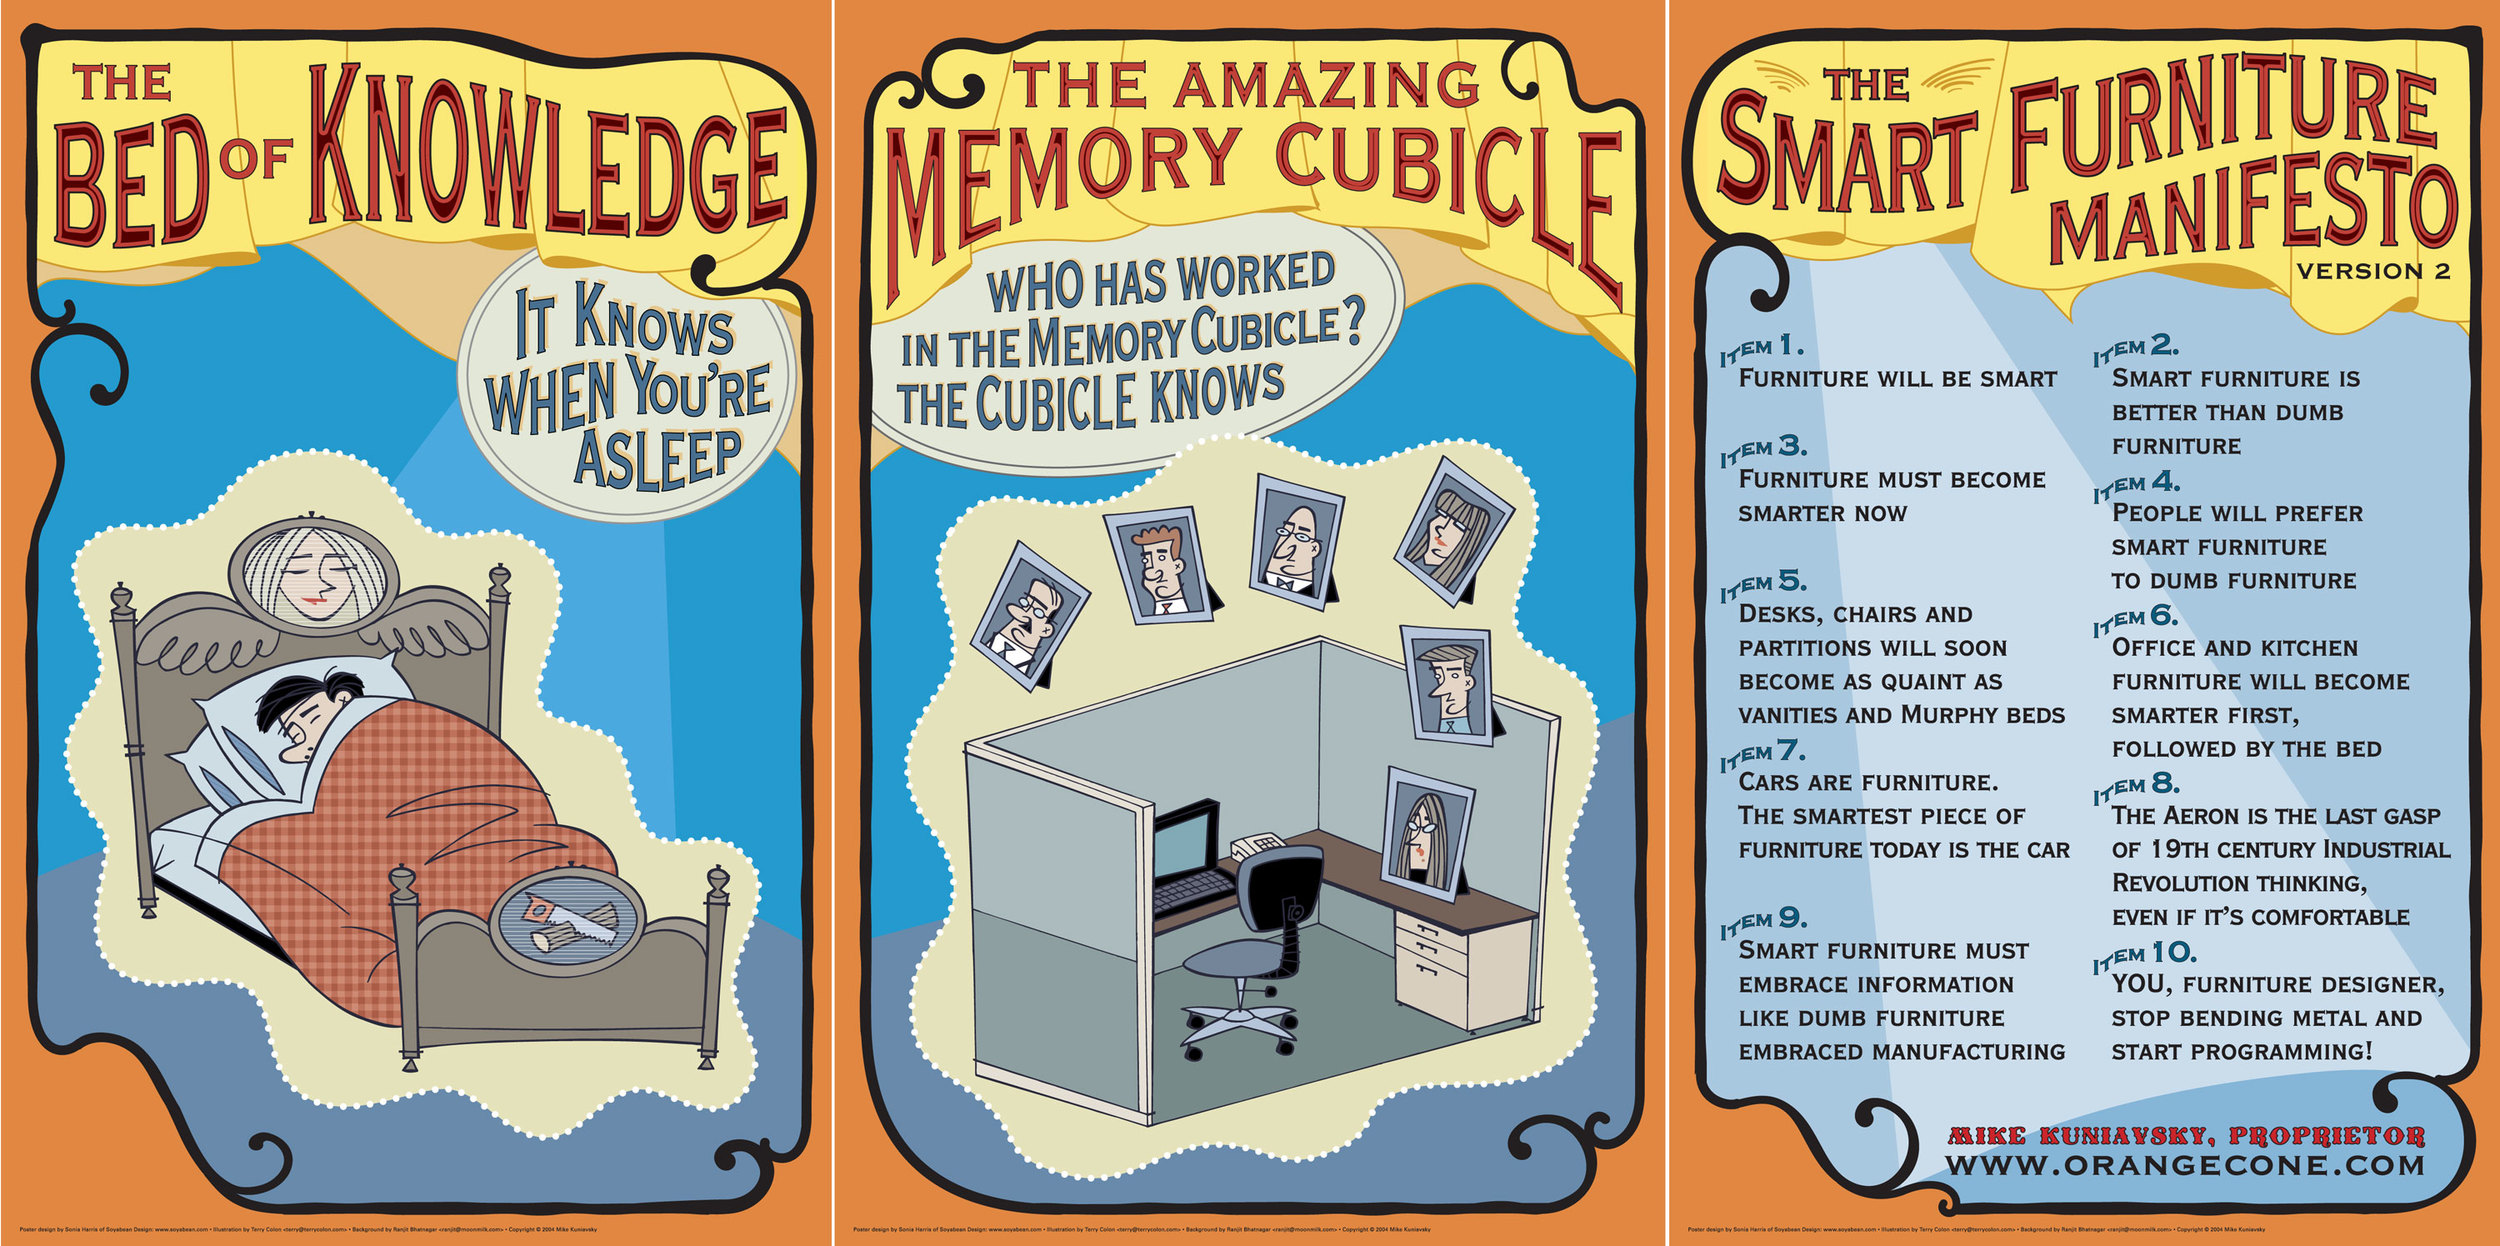
Three hand-lettered posters (with art by Terry Colon) for Mike Kuniavsky's Smart Furniture Manifesto.
2002
2002
2002
2002
2005
2005
2005
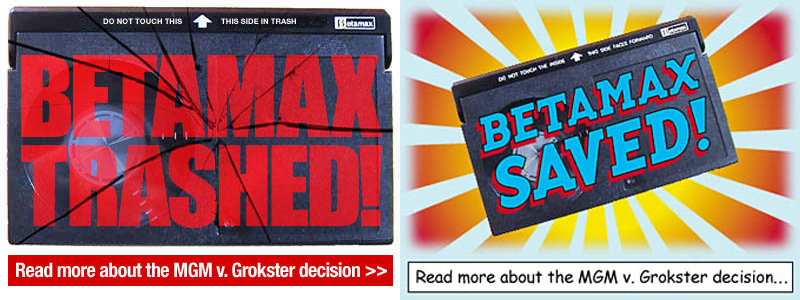
Dual illustrations created during the Betamax trial, one to be used based on the outcome.
2003
Illustrations of each herb used in this natural body product line from Body Bliss. Used as icons on packaging and literature.
2002
2001
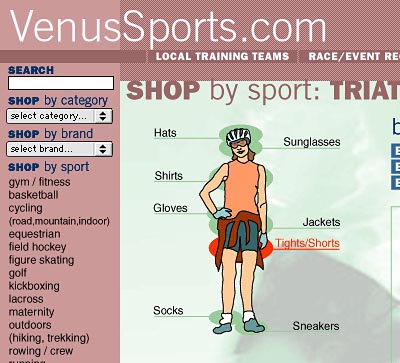
Vector-based figure drawing for clothing model on VenusSports.com.
1999
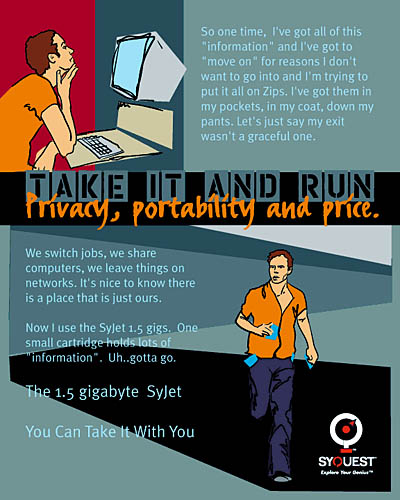
Vector-based drawings on this Illustrative ad for the Syquest data storage system.

1999
Photography and photo manipulation to create this illustration to go with the tagline "Advertising that sticks" and "Grab your online audience" for the GO Network advertising home page.

1998
Photographic compositions created to illustrate the computer capabilities.


2015
An infographic to accompany the last episode of the TV series "Fortitude", about a small town in the Antarctic which begins to experience some strange occurrences. Creating a detailed map of the connections between each character and the reasons for their actions provided a fun promotional tool for the show website.
2015
A comprehensive chart showing side-views of all significant Batmobiles used by Batman, created for Comic Book Resources. This was particularly tricky since some of the cars have never been shown from a side-view (or in the case of the "Batman v Superman: Dawn of Justice" there were not yet side-view images available), and so it became necessary to collect and study every angle available in order to extrapolate the construction of the side of the cars.
(Click here to view at full size.)
2015
A detailed comparison of the classic Batman television show car with Nolan's "Tumbler" from his Batman trilogy, created for Comic Book Resources. Each of the various functions and features of each car are detailed. To view more types of batmobile, check out the comprehensive chart here.
(Click here to view at full size.)
2012
I created this infographic for Participant Media and TakePart about the hidden diet and medical costs of Farm Bill food subsidies. More information on the
2014
An infographic to explore the changing kill count of the CW television show, Arrow. Combining icons, illustration, and bar charts to examine the statistics.
(Click here to view at full size.)
2013
Graphics and iconography to illustrate and explain the results of a survey of comic book readers' leisure habits, conducted by ComiXology.
(Click here to view at full size.)
2014
The center four pages of a six page, wordless illustration to describe the moment when the world ends and is reborn at the conclusion of the 12 issue comic book from Image Publishing, by Joe Casey and David Messina.
A digital collage of my photography with illustrative elements created in Photoshop and Illustrator.
2013
Graphics explaining and expanding on the results of an extensive survey of Superman comic book readers, conducted by ComiXology with DC Comics (released in conjunction with the movie "Man of Steel".)
(Click here to view at full size.)
2013
Sepia-toned infographic using period graphics to illustrate the findings of a contemporary study of American's awareness of President Lincoln for Take Part and Participant Media (released in conjunction with the movie.)
(Click here to view at full size.)
2012
An infographic celebrating the United Nations first ever “International Day of the Girl” on October 10th, this highlights how educating girls benefits all of society. Using the Intel color scheme and font for the body copy, with the TakePart title font for headers creates brand reinforcement for both companies.
(Click here to view at full size.)
2012
A simplified infographic celebrating the United Nations first ever “International Day of the Girl” on October 10th, this highlights how educating girls benefits all of society. Using the Intel color scheme and font for the body copy, with the TakePart title font for headers creates brand reinforcement for both companies.
(Click here to view at full size.)
2012
Infographic to illustrate research associated with themes raised in the film “The Best Exotic Marigold Hotel”, this supplements the research section on the Take Part website for the film. This version uses a vector outline of the marigolds used in film branding. More information on the website.
(Click here to view at full size.)
2011
Illustrative Grant Morrison logo to commemorate signing party for his book “Supergods” at San Francisco's Isotope Comics. Designed. Designed to emulate a Buddhist mandala, using symbolic shapes to represent Morrison’s creative process.
2011
Illustrative Grant Morrison logo to commemorate signing party for his book “Supergods” at San Francisco's Isotope Comics. Designed. Designed to emulate a Buddhist mandala, using symbolic shapes to represent Morrison’s creative process.
2008
2006
2005
2005
2004
Three hand-lettered posters (with art by Terry Colon) for Mike Kuniavsky's Smart Furniture Manifesto.
2002
2002
2002
2002
2005
2005
2005
Dual illustrations created during the Betamax trial, one to be used based on the outcome.
2003
Illustrations of each herb used in this natural body product line from Body Bliss. Used as icons on packaging and literature.
2002
2001
Vector-based figure drawing for clothing model on VenusSports.com.
1999
Vector-based drawings on this Illustrative ad for the Syquest data storage system.
1999
Photography and photo manipulation to create this illustration to go with the tagline "Advertising that sticks" and "Grab your online audience" for the GO Network advertising home page.
1998
Photographic compositions created to illustrate the computer capabilities.
